Omic.ly Weekly 39
August 27, 2024
Hey There!
Thanks for spending part of your Sunday with Omic.ly!
So, we're going to experiment with something new since I'm fresh off of a vacation.
And NEW content will now be first available to newsletter subscribers a whole week before it goes live on other channels.
That's probably the way it should have been from the beginning, but I'm still working on figuring out what the best content delivery strategy is for this thing.
I've gotten some good suggestions though, so keep them coming, I'm always looking for good ideas on how to make this newsletter more useful!
One that I've gotten multiple times is a request to start doing video interviews with people in the field which is an idea I've been toying with and might be something that happens in the new year.
We'll see, this thing already kind of consumes most of my evenings!
But I'm always excited to hear new ideas about what you'd like to see, (hear), and read!
This Week's Headlines
1) Would you like some Hi-C with that Woolly Mammoth?
2) Q-scores, what they mean, and why sometimes bigger isn't necessary
3) Rosalind Franklin's legacy goes well beyond her work on the structure of DNA
Here's what you missed in this week's Premium Edition:
HOT TAKE: Illumina recently courted investors with a presentation on how their new product R&D pipeline is going to resurrect the Illumina stock price
Woolly Mammoths were just big, furry, elephants, right? Maybe, and now we have the tools to compare the structures of their genomes.
The Woolly mammoth is the best studied of the mammoths because their remains have been found frozen and incredibly well preserved in Siberian and North American permafrost.
This has allowed for the collection of tissues from these ancient creatures who roamed the earth over 800,000 years ago.
Through genetic analyses, it has been shown that the closest living relative of the Woolly Mammoth is the smaller (and noticeably less woolly!) Asian elephant.
But performing genetic analyses on ancient specimens is tricky, even if they are well preserved in ice for millennia!
The half-life of DNA is ~ 500 years, and even if totally frozen, it’s estimated that every bond in a DNA molecule would be broken after about 7 million years.
So, suffice it to say, ancient DNA is highly fragmented, which makes it tough to reconstruct genomes of ancient organisms!
In many cases, paleontologists use a close living relative as a reference for genetic studies, but as we’ve seen in humans, this can create issues with properly aligning sequences to the appropriate locations in a genome.
And much like in humans, we’ve also come to appreciate the importance of epigenetics, chromatin structure and gene regulation in helping to define the differences that we see in an organism’s appearance.
But if ancient samples are already fragmented, how can we ever get structural information out of them?
With Hi-C.
This is a molecular technique that allows you to identify sequences of DNA that are physically close to one another.
It’s also perfect for reconstructing genomic maps and identifying what parts of the genome are actively expressing genes (because DNA that touches is usually open!)
Could it be possible for us to figure out what put the wool on the Woolly Mammoth???
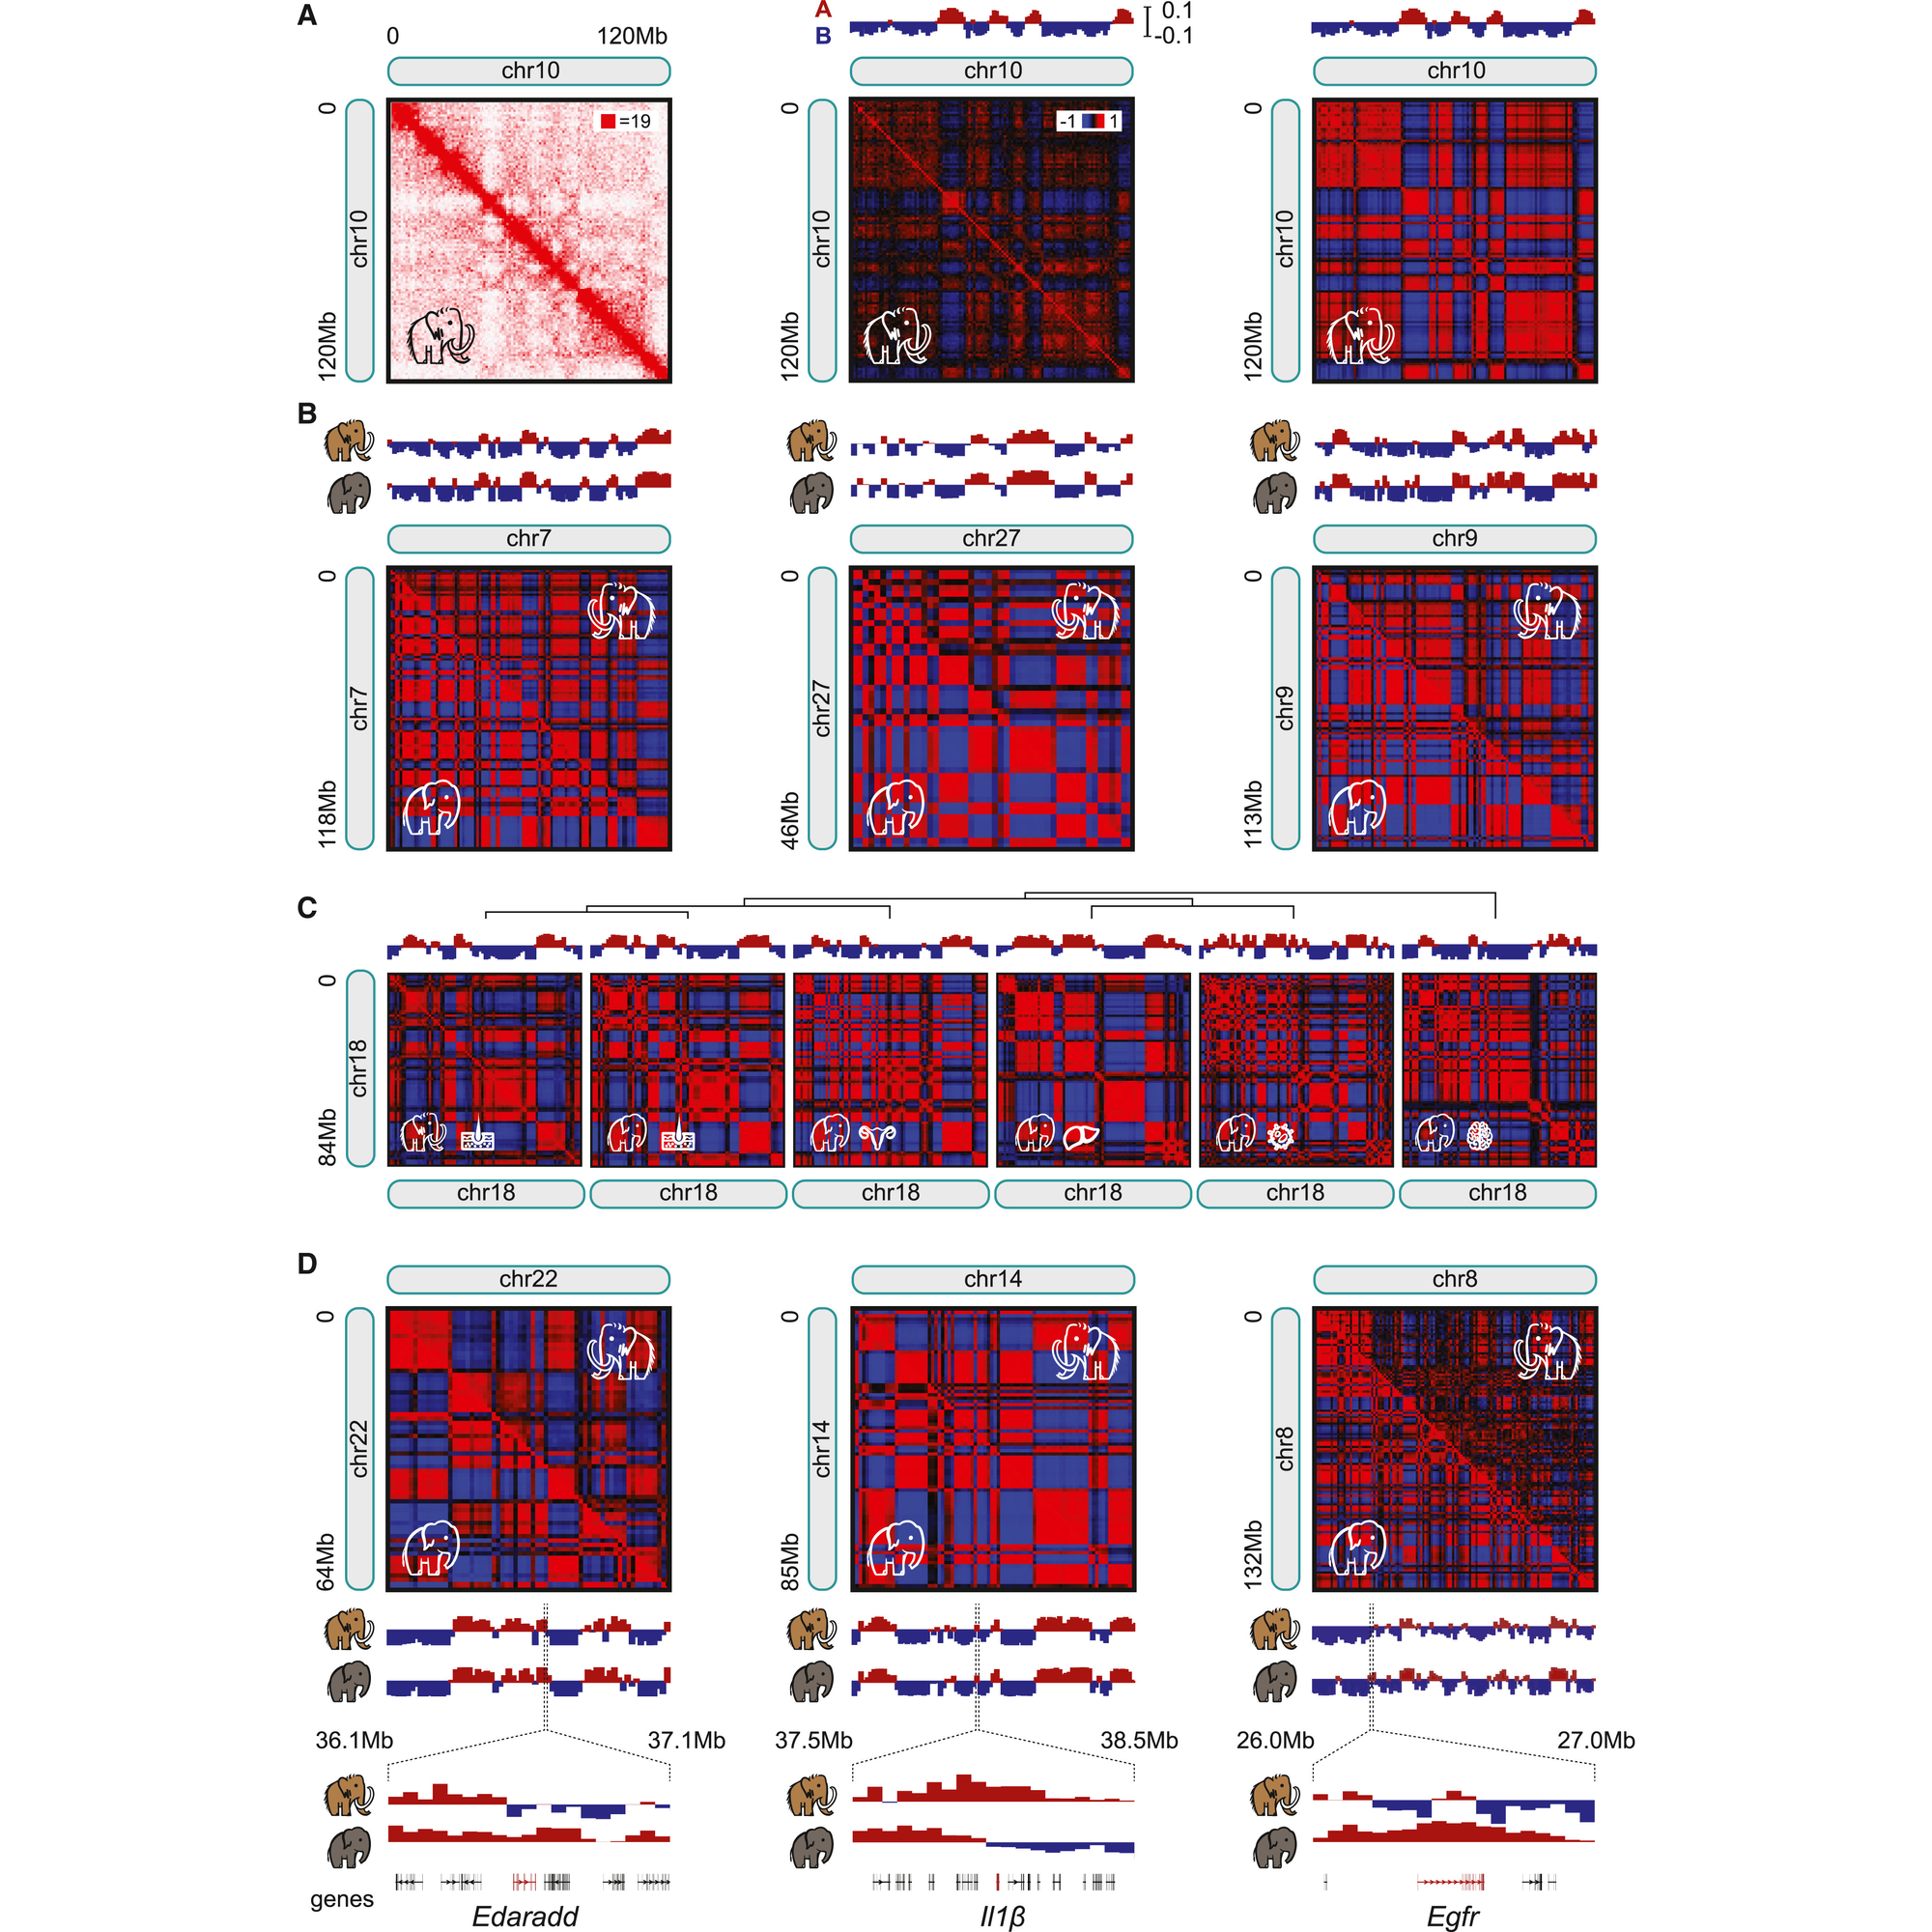
Maybe, but let’s not get ahead of ourselves, the researchers behind this paper first needed to show that it was possible to perform Hi-C on preserved mammoth samples and that they could get reasonable data out of them.
That experiment can be seen in the figure above where in a) they generate contact maps for chromosome 10, b) compare maps for chr7, 27, and 9 between mammoths and Asian elephants noting high correlation between the two animals, c) show that maps for skin are highly correlated but that chromosome architecture differs in other tissues (meaning, they’re getting real signal from mammoth skin!), d) there are sub-chromosomal differences in chromatin structure when looking at specific genes
So, why should you care?
This paper shows that techniques like Hi-C can be used to help us better understand the critical genetic (and epigenetic!) differences that define how organisms have evolved over time.
###
Sandoval-Valesco M, et al. 2024. Three-dimensional genome architecture persists in a 52,000-year-old woolly mammoth skin sample. Cell. DOI: 10.1016/j.cell.2024.06.002
High throughput sequencing metrics: Q-scores, what are they good for?
If you've done sequencing in the last 30 years, you've heard of a Q-Score and you probably know that they're a measure of quality.
But what you might not know is where this metric came from.
The idea of base quality scores emerged in the early 1990's as a result of the automation of Sanger sequencing.
These new systems used fluorescent dye terminators instead of radioactively labeled ones.
This meant that instead of looking at bands on a gel to determine the sequence, scientists now analyzed fluorescence and so a program called 'Phred' was developed to make accurate base calls from the fluorescence intensity plots.
But a huge advancement in Phred was the inclusion of a quality score for each base call that it made.
We lovingly refer to these today as Q-scores!
These Q-scores are a log based estimation of the quality of the call.
Phred determined this originally based on an error estimation that took into account the peak height and shape of the fluorescence 'trace' for each base.
Today, these scores are calculated somewhat similarly in that they're still the log of an error estimation, but the factors that go into that estimation can be quite complicated!
The Q-scores we deal with most frequently range from 10-50 and they have the following accuracies:
Q10 - 90%
Q20 - 99%
Q30 - 99.9%
Q40 - 99.99%
Q50 - 99.999%
'So is there a benefit to having a higher Q-score or are they just a marketing scam?'
That's complicated.
They're not a scam since most pipelines Q20 or Q30 trim their base calls to be sure that only bases with a quality of >99% make it into downstream analysis.
'But is there a difference in the usefulness of a Q50 dataset over a Q20 dataset?'
It really depends on the application.
Something we hear about constantly in the whole genome sequencing space is the need for 30x coverage for us to make heterozygous (het) variant calls.
This is important because, if you remember, your genome is composed of two copies of DNA: one from your mom and the other from your dad.
So every position in your genome can be homozygous (same sequence from both parents) or heterozygous (different sequence from each parent).
Interestingly, sampling statistics (math) say that to be >99% certain of a heterozygous base call, you need to look at each position in the genome 30 times.
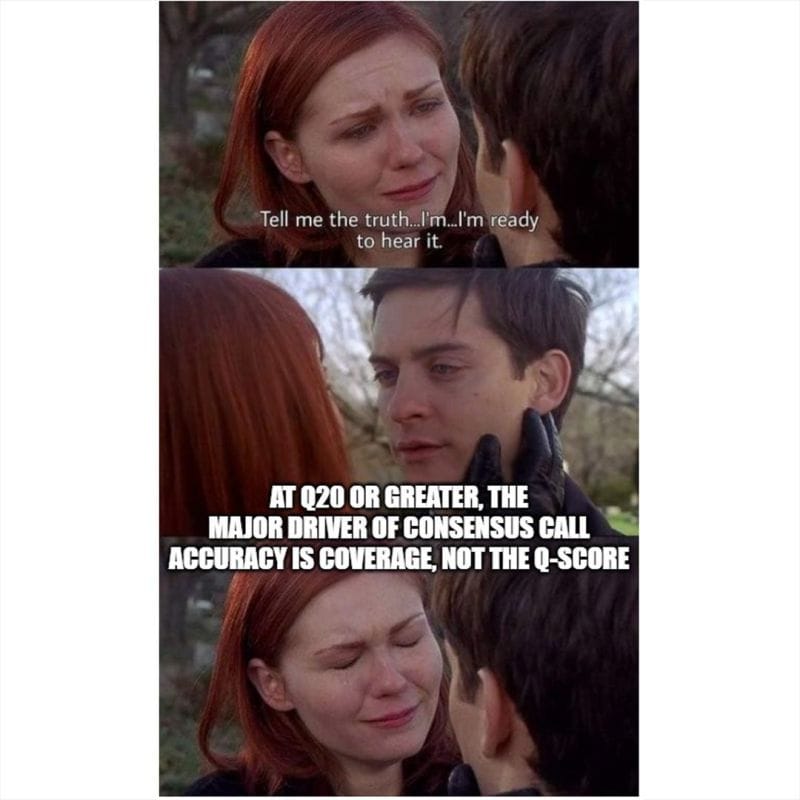
But even more interestingly, if you look at plots of variant call accuracy vs coverage for Q20, Q30, or Q40 data, they all converge on ~30x coverage for >99% het variant calling!
'So it is a scam!!!'
No, it's just math.
There are applications where higher quality bases are useful, especially in oncology or therapeutics where the variants you care about aren't at frequencies of 50% and 100%, but sub 1% or even lower.
Here, Q40 (99.99%) or Q50 (99.999%) really shine because then the error of the base calls isn't fighting with the frequency of the variants!
The most famous photo in the history of genetics wasn’t generated by Watson and Crick, but that didn’t stop them from using it to solve the structure of DNA.
While they tend to get all of the credit for this structure, 3 papers were published back-to-back on this topic in April of 1953:
1) Watson and Crick’s has a single, hand-drawn, 3D structure of DNA.
2) Wilkins' includes a blurry diffraction pattern.
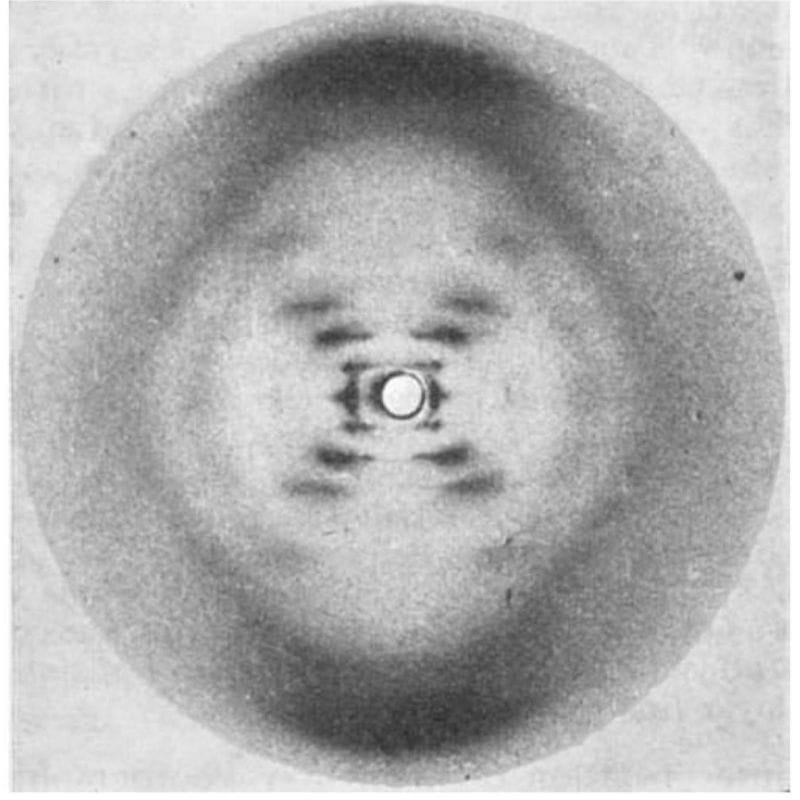
3) Franklin and Gosling's, shown in the figure above, has the pristine diffraction pattern of DNA known as Photo 51. Their analysis showed that the structure is helical, it's double stranded, and the bases face inward with the phosphate backbone on the outside.
So, why are there 3 papers?
In the early 1950’s, scientists were coming around to the idea that DNA was the genetic material, but the publication of the Hershey-Chase experiment in 1952 removed all doubt.
Soon after, Linus Pauling, an American structural biologist, published a triple-helical structure of DNA (with the bases facing outward).
Unfortunately for Pauling, his structure was based on flawed data but this put the teams in the UK on notice.
Watson and Crick were at Cambridge while Wilkins, Franklin and Gosling were at King’s College London.
Wilkins did much of the early work generating x-ray diffraction patterns of DNA, but it was Franklin and her PhD student, Gosling, who perfected the art.
In May of 1952, Gosling generated photo 51 of B-DNA, but Franklin was more interested in studying A-DNA.
So, photo 51 wasn’t revisited until she decided to leave King’s.
Since Gosling was transferring to Wilkins to complete his PhD, photo 51 was shared with him and he in turn shared it with Watson.
Realizing this fixed all of their problems, he and Crick completed the model for their structure of DNA, culminating in the publication of all 3 papers in 1953.
Unfortunately, Franklin died of ovarian cancer in 1958 and Watson, Crick and Wilkins won the Nobel in 1962.
The story of photo 51 is incredible, but what’s even more incredible is that Franklin’s contribution was nearly forgotten.
This changed when Watson’s misogyny got the better of him.
In his 1968 memoir, he composed a very unkind depiction of Franklin (He apologized in a later edition).
This sparked renewed interest in her and corrected portrayals of her and her work have been published:
She was a pioneer of x-ray crystallography.
She provided the key diffraction pattern for the structure of DNA.
She resolved the structure of RNA in Tobacco Mosaic Virus.
And, prior to her death, she worked on polio virus.
Her collaborator, Aaron Klug, finished this project and was awarded the Nobel Prize, in part, for his crystallography work.
Though short a Nobel (or two), Rosalind Franklin's scientific legacy is extraordinary.
###
Franklin RE and Gosling RG. 1953. Molecular Configuration in Sodium Thymonucleate. Nature. DOI: 10.1038/171740a0
Were you forwarded this newsletter?
LOVE IT.
If you liked what you read, consider signing up for your own subscription here: