Omicly Weekly 10
February 4th, 2024
Hey There!
Thanks for spending part of your Sunday with Omicly!
This week's headlines include:
1) Proteomics based MCEDs are coming in hot and will probably hit the market sooner than anyone thinks.
2) There are lot's of cool new ways to measure the proteome!
3) The discovery of the DNA double-helix was the culmination of decades of work from numerous contributors.
Please enjoy!
Proteomics is coming to the oncology market faster than any of you think. This paper shows why.
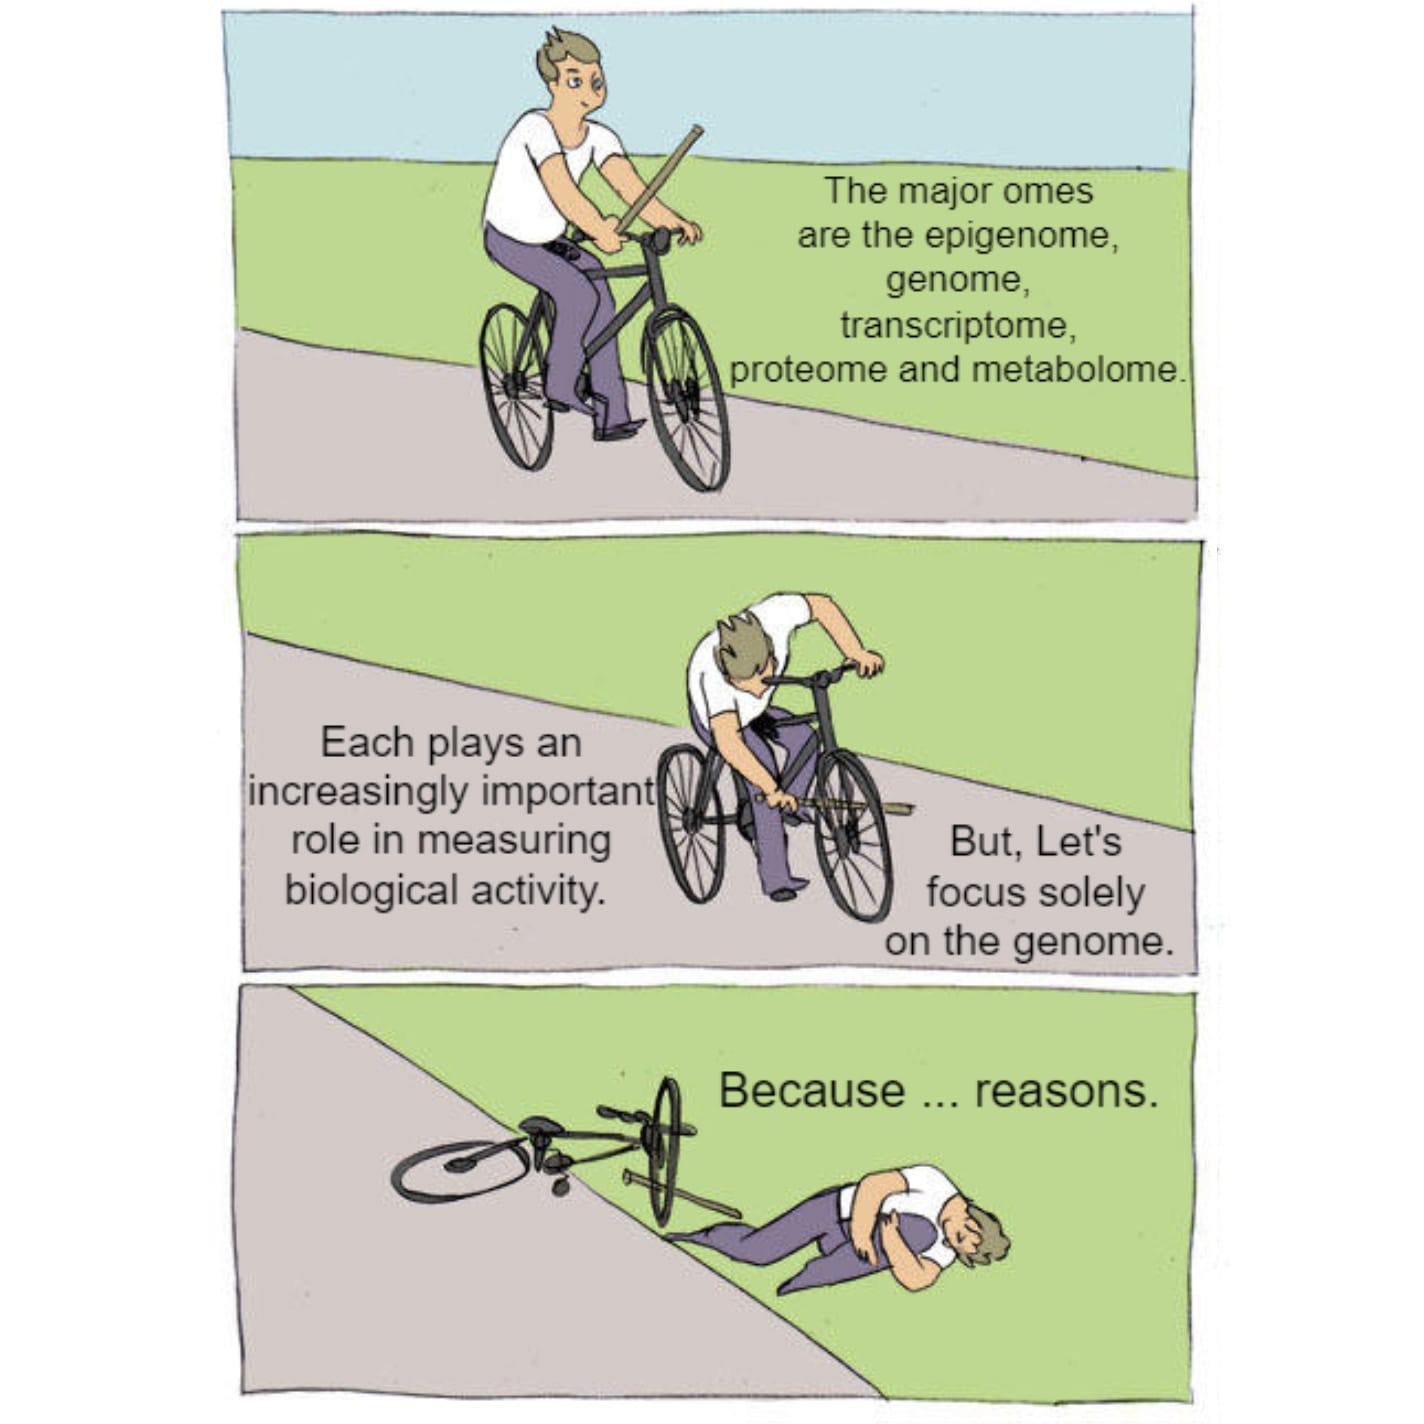
One of the early promises that was made during the pitch for funding the human genome project was that once we had figured out the code of life, we'd be able to understand and cure all diseases.
In retrospect, (and even at the time) scientists knew this was hyperbole and that the genome was really just the bottom of the molecular biology pyramid.
Knowing the sequence of the bases is important, but it tells you very little about what is actually expressed by the genome.
For that you need other tools to look at the products of the genome like mRNA, proteins, and metabolites from cellular processes but also modifications to the genome itself that control which parts of it are accessible.
Together we refer to the genome plus all of these other things as the 'multi-ome.'
One of the hardest of these other 'omes' to measure is the proteome.
It represents all of the proteins that make up the little machines that allow our cells to function.
Each of our cells expresses different proteins, and these work together, ultimately creating all of the tissues that make up our bodies.
However, in diseases like cancer, these cellular functions are disrupted due to mutations in the genome that change what is expressed or alter how those proteins function.
We can pick up some of these signals by looking at the genome, but we can get an actual read out of the biology of these cells by looking at the composition of the other 'omes' in the bloodstream!
Up until about 10 years ago, looking at proteins was a very tedious task requiring gels and antibodies or highly complex purification schemes paired with tandem mass spectrometry.
Now we have new techniques for quantifying thousands of proteins at once which gives us a much more comprehensive look at the underlying biology of cancers.
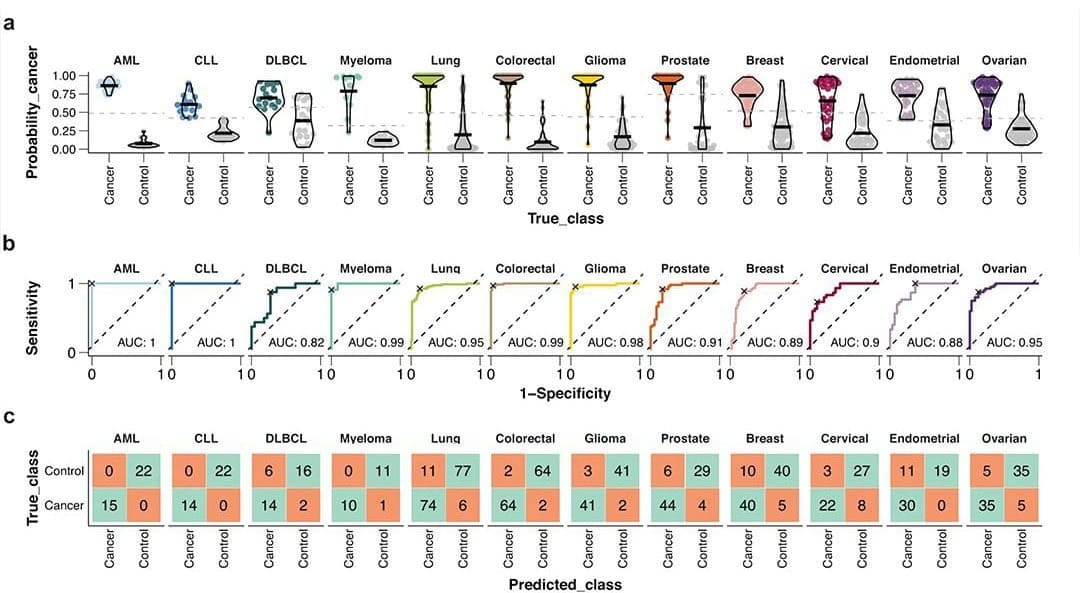
The paper I'm showing a figure from today was written by the group behind the Human Disease Blood Atlas and they characterized 1,463 proteins in more than 1,400 cancer patients.
They then took the data from those results and used machine learning to develop algorithms for predicting AML, ALL, DLCBL, Myeloma, Lung, Colorectal, Glioma, Prostate, Breast, Cervical, Endometrial, and Ovarian cancer.
They followed up by detecting those cancers with relatively high sensitivity and specificity including AUCs for 6 out of 12 above 0.95 (and above 0.8 for the rest!).
While not perfect, this is pretty freakin' good for a first crack, and this work highlights the future potential for proteomics in multi-cancer early detection (MCED).
With some optimization and a more comprehensive method validation, proteomic approaches could make the current players in the MCED space sweat!
###
Álvez MB et al. 2023. Next generation pan-cancer blood proteome profiling using proximity extension assay. Nat Commun. DOI: 10.1038/s41467-023-39765-y
High throughput proteomics could revolutionize our understanding of human disease, but it's going to take some major innovations to get us there!
Proteomics is the study of all of the proteins produced by an organism.
Proteins are:
Enzymes, structural components, signaling molecules, hormones, etc.
They basically do all of the work while DNA and RNA sit around and watch!
But proteins are also the ultimate end product of the information stored in our DNA and are created as a result of two processes:
Transcription - the conversion of DNA into the RNA message.
Translation - the conversion of that RNA message into functional protein.
For decades, DNA and RNA have stolen the show, mostly because innovations in nucleic acid sequencing have made decoding these messages a relatively simple process.
While we can glean some information about the biological status of an organism or tissue by sequencing DNA and RNA, we can actually measure functional biology by looking at the proteins!
And it's the proteins, or lack thereof that cause disease!
So why haven't we heard anything about proteomics?
In some respects, you have.
Many of the diagnostic tests that are administered when you see a physician are measuring protein concentrations or enzyme activity.
Unfortunately, the majority of these only look at a single protein at a time.
But, the real magic lies is in being able to measure all of the proteins!
And not just the select few that we've already found to be clinically relevant!
How can we measure thousands of proteins all at the same time?
We have options:
Mass Spectrometry - The go-to in this space has historically been matrix-assisted laser desorption/ionization (MALDI) and time-of-flight (TOF) mass analysis. This technique works by ionizing proteins, smashing them into a detector, and then imputing what was present before the ionizing and smashing.
Antibody/Aptamer Arrays - An old, low throughput, standby of protein detection has been the use of antibodies. However, innovations like those implemented by Olink which add a sequence tag to antibodies facilitates the multiplex counting of thousands of proteins at a time making this process much more high throughput with a wide dynamic range. A competing technology from Somalogic works similarly, however, they’ve created custom RNA aptamers to do the dirty work.
Protein Sequencing - This is done through a systematic decay and detection process. This involves the labeling of specific amino acids (Erisyon) and imputation of the peptide present based on where those labels appear or the use of fluorescent ‘recognizers’ (Quantum-Si) to detect the terminal amino acids throughout the decay process.
These methods can allow us to look at a wide array of proteins, and quantify them, (proteomics!) to better understand how changes to the genome affect the biology of our cells and, ultimately, better understand health and disease.
History is written by victors, and that statement couldn't be more true than it is in the case of Watson and Crick's 'discovery' of the DNA double helix.
Their structure was published in the April 1953 issue of Nature along with two other papers on the same topic from Wilkins and Rosalind Franklin.
Although they don't cite Franklin in their 1953 paper, they definitely used her data.
It was Franklin's paper that included Raymond Gosling's pristine diffraction of B-DNA, known as Photo 51, that showed the structure of DNA is helical, it's double stranded, and the bases faced inward with the phosphate backbone on the outside.
While this is a good chunk of what you need to know to put the structure of DNA together, there were a couple of additional missing pieces that the boys from the Cavendish Lab had to source.
What gets lost in all of the popular coverage of this discovery is that Watson and Crick didn't perform any experiments, they aggregated the best science at the time to create their model.
Franklin wasn't the only person they borrowed from.
Phoebus Levene's life was spent studying DNA, he's why we call the bases nucleotides and he showed that DNA has a 5'-3' deoxyribose sugar phosphate backbone but also that the bases are composed of adenine, thymine, guanine, and cytosine.
Erwin Chargaff shared with them what he knew about the ratios of the bases, or Chargaff's rule, which is that A and T, and G and C are found paired in a 1:1 ratio.
He had a famously checkered opinion of the duo and even went as far as to say, "I told them all I knew. If they had heard before about the pairing rules, they concealed it. But as they did not seem to know much about anything, I was not unduly surprised."
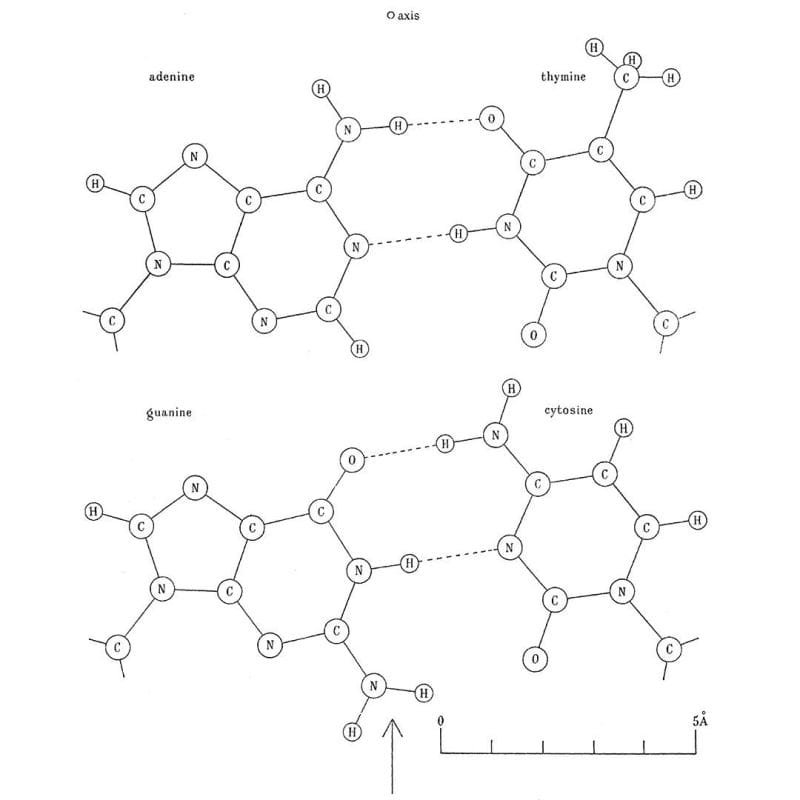
Next on the list was hydrogen bonding between the bases. This little known fact was cribbed from the thesis work of a graduate student at the time, June Broomhead (Lindsey), who also proposed all of the possible structures for A, T, G and C.
But knowledge of that final piece of the puzzle came from Jerry Donohue who shared an office at Cambridge with Crick.
He noticed that Crick was trying to pair up the bases using their 'enol' forms and so Donohue suggested, based on Broomhead's work, that Crick should try to smash the 'keto' forms together instead because they were much more common.
The image above is Crick's smashing result: Watson-Crick(-Broomhead-Donohue?) base-pairing. It was published in 1954 in a much longer and more detailed follow-up paper on the structure of DNA.
While historic, this story is nuanced, and I'll leave you with Crick's measured interpretation of the situation.
"What, then, do Jim Watson and I deserve credit for? The major credit I think [we] deserve … is for selecting the right problem and sticking to it."
I tend to agree.
###
Crick FHC, Watson JD. 1954. The Complementary Structure of Deoxyribonucleic Acid. Proc. R. Soc. A. DOI:10.1098/rspa.1954.0101