Omic.ly Weekly 48
November 4, 2024
Hey There!
Thanks for spending part of your week with Omic.ly!
This Week's Headlines
1) A USB drive? Nah, an epigenetic drive!
2) A not-so-deep dive into Single Cell and Spatial Transcriptomics
3) Linus Pauling molecularly characterized the first Mendelian Disease: Sickle Cell Anemia
Here's what you missed in this week's Premium Edition:
HOT TAKE: Will PacBio's new chemistry SPRQ renewed interest in clinical long-reads?
Or if you already have a premium sub:
DNA data storage is coming for all of your bits (but now with an epigenetic spin)!

Deoxyribonucleic acid, which we lovingly refer to as DNA, is the ultimate biological data storage material.
It stores most of the information required for us to function within its sequences of adenine, thymine, guanine, and cytosine!
And because DNA is so small, it has been the envy of computer scientists who see it as a potential solution to our impending data storage dilemma.
We’re currently creating over 400 terabytes (TB) of data a day.
A typical 15 TB data storage tape weighs 200 grams which comes out to roughly 0.075 TB per gram.
DNA can store 215 Petabytes (PB) per gram.
A PB is equal to 1000 TB.
So, DNA can store *checks math* 13,333 times more data than a typical tape drive!
You can see why we might be interested in using DNA to help satiate our data storage needs.
But, up until now, all discussions of DNA based data storage have been around methodically synthesizing long stretches of DNA to encode information.
This is very expensive, slow and hard to scale.
Fortunately, there’s a relatively unexplored alternative DNA based storage method that our cells use every day that doesn’t require the complicated and methodical synthesis of DNA.
You might remember that the DNA bases themselves don’t provide all of the data that’s required for our cells to function.
There’s a lot of information encoded in the non-sequence based parts of our DNA and epigenetic modifications to DNA bases could potentially be used for data storage!
This would allow us to encode information into bits of DNA using things like DNA methyltransferases instead of having to bulk synthesize new sequences.
And because sequencers from PacBio and Oxford Nanopore can natively read epigenetic modifications now, we have high quality epigenetic data retrievers at our disposal!
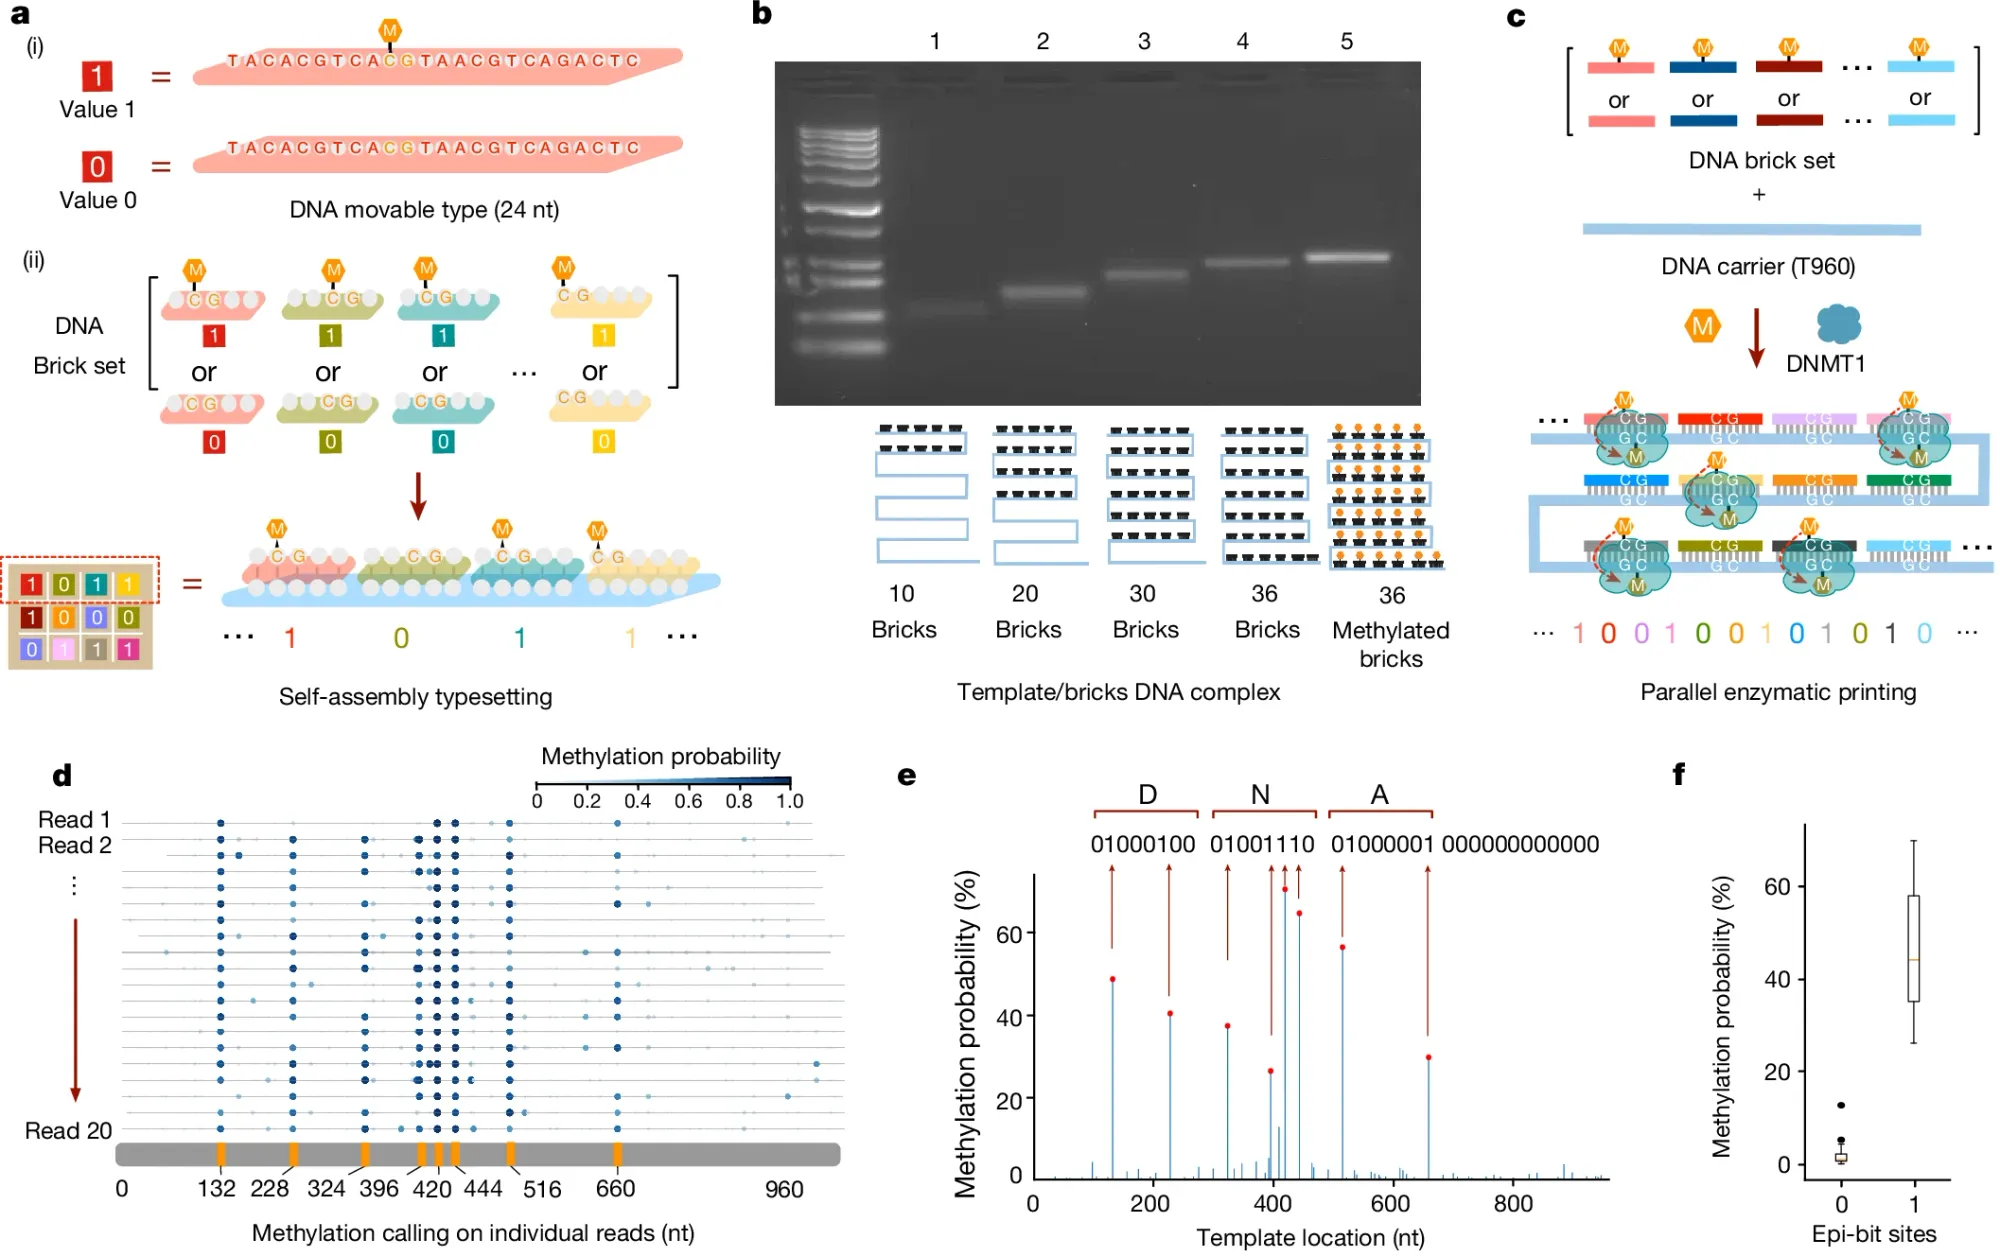
In the figure above, the researchers behind this week’s paper leveraged an additional emerging technology to perform this task: DNA self-assembly.
a) They used 24 base pair DNA ‘bricks’ to represent binary 1 or 0 codes and the self-assembly (hybridization) of these methylated (1) or unmethylated (0) bricks to a complementary template is how they began the process of encoding the data into the template
b) shows they can detect size and methylation differences of template hybridized bricks on a native gel
c) explains how a DNA methyltransferase (DMNT1) is used to copy the methylation signal from the bricks to the template
d) highlights how methylation aware sequencing of the methylated template is used to read back the encoded data
e) is a graph of the final consensus calls for the methylation status of each brick (‘DNA’ was spelled in binary code)
f) displays the error of the methylation calls (no methylation has much lower error than methylation calls)
The researchers went on to show they could store complicated information within this ‘epi-bit’ system, storing an image of a tiger, a panda, and encoding large blocks of text.
However, this system wasn’t perfect and in the worst case had an error rate at data retrieval of nearly 10%.
Errors can be introduced in multiple places including during encoding, storage (methylation signals can be lost), and errors during sequencing.
These should all improve as the technology is developed further.
But, as a proof-of-concept, it’s quite exciting to see how we might finally be able to use DNA to efficiently and cost effectively store more than just biological data!
###
Zhang C, et al. 2024. Parallel molecular data storage by printing epigenetic bits on DNA. Nature. DOI: 10.1038/s41586-024-08040-5
Put on your dive gear: we're going deep on single-cell and spatial transcriptomics methods!

Single-Cell Methods:
FACS - Fluorescence-activated Cell Sorting isolates cells using fluorescence and laser deflection by staining cells with a dye or by tagging them with antibodies. Capable of sorting >100 cells per experiment. Examples: Smart-Seq, MATQ-Seq, and CEL-Seq
Microdroplets - Single-cells are isolated by flowing cells and reagents through a device to create single-cell containing oil microdroplets. In many cases a bead covered in poly-T sequences is used to capture the 3’-end of RNA transcripts. Cannot recover full-length transcripts. 10,000+ cells at a time, >50% recovery. Examples: 10x Chromium, Complete Genomics DNBelab, and Drop-Seq
Microwells - Instead of isolating cells in droplets, microfluidics or limiting dilution are used to sequester cells into microscopic wells on a plate or a slide. This technique also allows for the sequencing of full-length transcripts. Examples: BD Rhapsody (10,000+ cells), Fluidigm C1 (800+ cells)
Combinatorial Barcoding - The latest advancement in single-cell is the use of combinatorial barcoding to label transcripts within fixed cells without having to use any fancy or expensive instruments up-front. In-cell reverse transcription with a barcoded primer is performed followed by two rounds of splitting the cells into new 96 well plates and ligating new barcodes. A 4th barcoding split is done using a PCR reaction. 10,000+ cells at a time, <50% recovery. Examples: SPLiT-Seq, Parse Biosciences, Scale Biosciences.
Spatial Methods:
Microdissection - Prepared histology slides can be microdissected in two different ways. Traditional laser capture microdissection can be performed and regions sequenced. Alternatively, slides can be labeled with oligo tagged RNAs or antibodies and then those sequence tags released by the exposure of regions of the slide to UV light. Sequencing of the tags tells you which RNAs/Proteins were present in each dissected region. Example: Leica, etc (Laser Capture), Nanostring GeoMx (UV)
Microarray - Histology slides can also be overlaid with RNA capture arrays like the Illumina beadarray to divine spatial information. This was introduced as Slide-seq but has been commercialized by 10x as Visium.
Multiplex FISH - This is basically Fluorescence In-Situ Hybridization on steroids. Histology slides are prepared and exposed to multiple fluorescently tagged RNA probes. Multiple rounds of fluorescent tagging followed by imaging allows for the detection of gene specific signals at the cellular level. Examples: Vizgen/UltiVue MERFISH, Nanostring CosMx
In-Situ Sequencing - Uses sequencing technology to extend random or transcript specific primers in a rolling circle amplification reaction. Sequencing proceeds using 1-2 base labeled probes with imaging after every cycle of probe addition and provides cellular transcript localization. Examples: 10x Xenium, Element Teton
Sickle Cell Anemia was the first inherited disease to be molecularly characterized. It was done in 1949 using a revolutionary new method: electrophoresis.

Sickle cell anemia affects 4.4m people, and 43m are carriers of the trait.
It is characterized by the crescent, or sickle shape, of the red blood cells of those affected by the disease.
James Herrick first discovered sickle-shaped blood cells in a patient suffering from severe anemia in 1910.
Through subsequent observation it was realized that there was an asymptomatic form of the disease, sickle cell trait.
In those individuals it appeared that they had a mixture of normal and sickle blood cells.
Further study within the families of these individuals in 1923 revealed that sickle cell was hereditary or passed down from parents to their offspring.
And because those with sickle cell trait appeared to have a 50/50 mix of sickle/normal blood cells, it was determined that this was a recessive Mendelian disease.
Linus Pauling, a titan of early molecular biology, was no stranger to blood or the protein hemoglobin and spent many years in the 1930’s studying hemoglobin’s interactions with oxygen.
Pauling had a suspicion that the structure of proteins played a vital role in their function and was first introduced to sickle cell anemia in 1945.
He hypothesized that the sickling of cells could be related to a change in the structure of hemoglobin since red blood cells are literally just bags that contain a boat load of hemoglobin protein.
So, he and his team, Harvey Itano and John Singer, tried to figure out a way that they could show that a difference in the structure of hemoglobin was the cause of sickle cell anemia.
After a bit of trial and error, they stumbled on the use of electrophoresis, a brand-new technique at the time, that allowed for the separation of molecules based on their electrical charge.
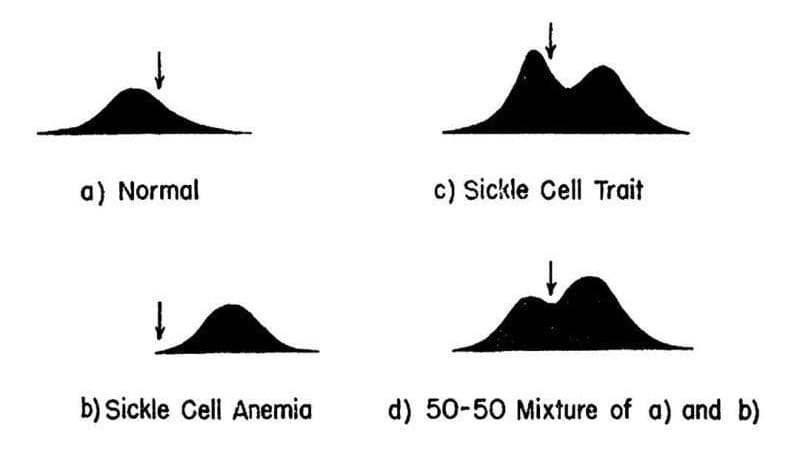
The results of their experiments can be seen in the figure above.
They separated and quantified 4 sets of blood samples using Longsworth scanning diagrams. A) shows normal hemoglobin, B) is hemoglobin from a sickle cell patient, C) is hemoglobin from a patient with sickle cell trait, and D) is a mixture of A and B. The arrow denotes a point of reference for comparing the diagrams.
This work demonstrates that there is a molecular basis for sickle cell anemia and that changes to a gene can alter the structure of a protein.
In the case of sickle cell, this functional relationship extends further because in the 1950’s, the trait was shown to be protective of malaria.
This explains evolutionarily why this disease is found in individuals of African descent; however, it fueled an unfounded fear of 'black blood' throughout the early 1900's.
###
Pauling L et al. 1949. Sickle Cell Anemia, a Molecular Disease. Science. DOI: 10.1126/science.110.2865.543
Were you forwarded this newsletter?
LOVE IT.
If you liked what you read, consider signing up for your own subscription here:
