Omic.ly Weekly 43
September 22, 2024
Hey There!
Thanks for spending part of your Sunday with Omic.ly!
This Week's Headlines
1) A genetic investigation into the 'population collapse' of Easter Island
2) Pangenomes are here to bring equity to genomics
3) The structure of DNA proposed by William Astbury and Florence Bell in 1938
Here's what you missed in this week's Premium Edition:
HOT TAKE: Guardant Co-CEO's million dollar bet roils patients, employees and anyone with two functioning brain cells
Or if you already have a premium subscription:
What caused the 'collapse' of the Rapanui population on Easter Island? Genetics is now setting the record straight.
Easter Island, or Rapa Nui, is in the eastern most corner of the triangular region of Pacific Islands that make up Polynesia.
Hawaii and New Zealand hold the other two corners.
With that in mind, it’s pretty clear that Polynesia is huge!
It also contains thousands of islands that have been inhabited by sea faring people for centuries.
But, it is thought that Easter Island was first settled in the 12th century and those settlers became known as the Rapanui.
These people developed a culture centered around the iconic giant stone moai statues that can be found all over the island.
The island is still inhabited today and is one of the most remote island populations known to exist, being 2,200 miles (3,500 km) from the coast of Chile in South America.
Prior to settlement, Easter Island was typical of many subtropical islands and the fossil record indicates that it was probably covered in broadleaf palm forests.
Today, many of those original species no longer exist and the island is covered in low vegetation leading some people to believe that the Rapanui mismanaged the ecosystem.
In 2005, a book was published hypothesizing that because of this ecocide (ecological suicide due to extreme deforestation), the Rapanui experienced a serious population collapse, and cannibalism led to a reduction of the population from approximately 15,000 inhabitants to 3,000.
Archaeologists were quick to point out that there was no credible evidence of a population collapse or cannibalism on the island outside of traditional religious rites.
They also highlighted that the palm forests were replaced with farm fields to support the growing population.
The only recorded evidence of a collapse was in the mid 1800’s when Peruvian slave traders raided it and removed or killed half of the population.
But this ecocide myth still persists today.
Thankfully, a recent paper in Nature finally puts it to rest.
To do this, researchers sequenced 15 ancient Rapanui genomes dated from 1670–1950 ce.
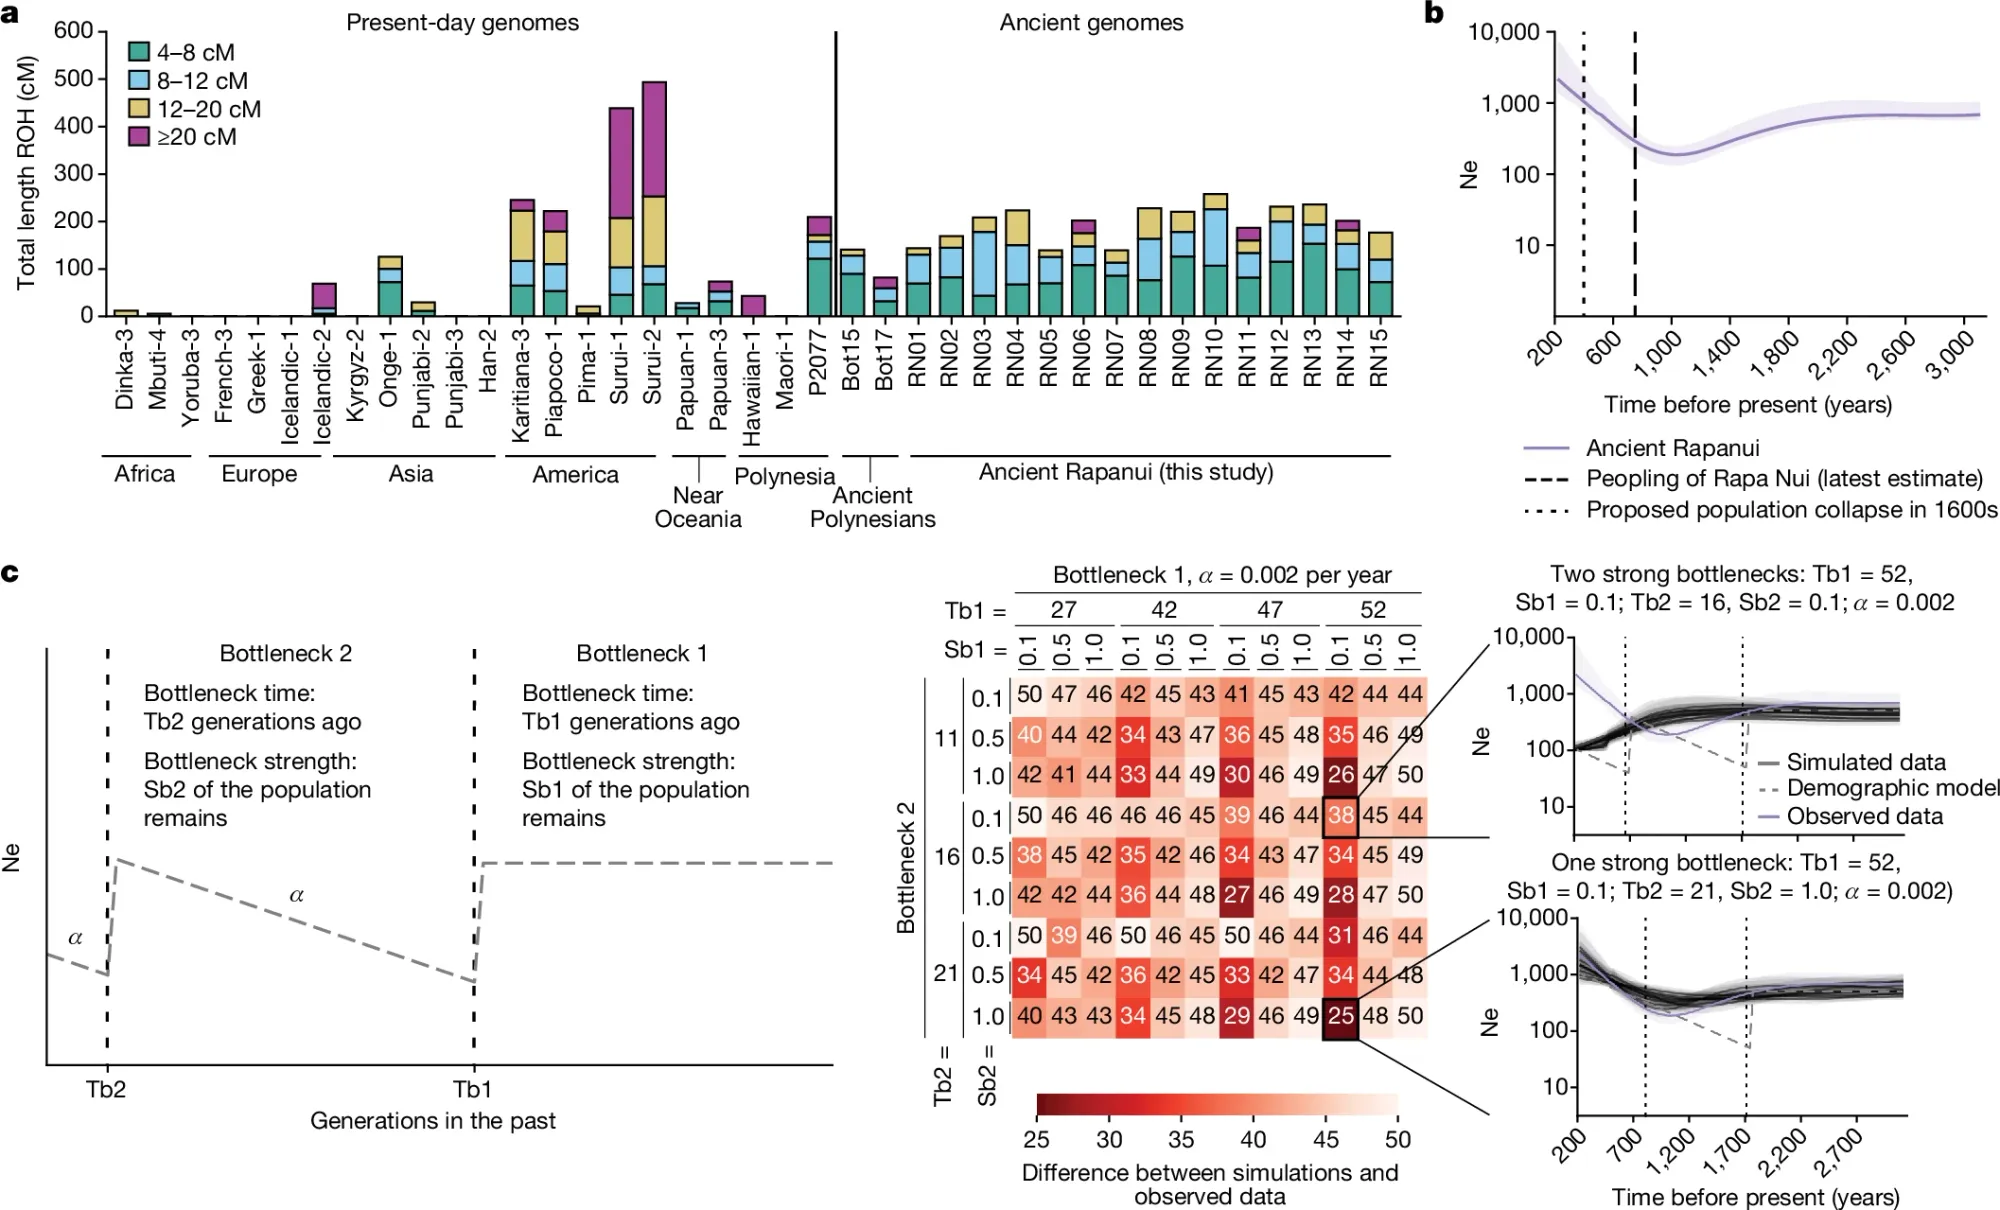
In the figure above they:
a) Compare regions of homozygosity (long regions >20cM (centimorgan) indicate more inbreeding) in other populations and show that the ancient Rapanui are similar to other modestly isolated populations and do not appear to have suffered a severe genetic bottleneck
b) Use the ancient genomes and population genetics to estimate the population size (not quantitatively - just looking for trends) of the Rapanui throughout their history and do not show a severe population collapse 600 years ago
c) Model the worst case population collapse scenarios to replicate the curves observed in the genome data (compare black lines to light purple line - right side) and show that the observed curve is most consistent with a single founder event at settlement (bottom graph) and not an ecocide driven population collapse in 1600 (top graph).
###
Moreno-Mayar J, et al. 2024. Ancient Rapanui genomes reveal resilience and pre-European contact with the Americas. Nature. DOI: 10.1038/s41586-024-07881-4
Reference genomes: what they are and why the next big thing in genomics is the human pangenome.
The human genome project started in 1990 and was declared complete in April of 2003.
In actuality, only about 90% of the genome was finished then, but the pesky telomeres (ends of chromosomes), centromeres (centers of chromosomes) and a bunch of lengthy repetitive regions remained elusive.
The human genome wasn't actually completed telomere-to-telomere (T2T) until January of 2022 and that's thanks to the development of long-read sequencing and mapping technologies that didn't exist when the human genome was originally sequenced.
But the 'human genome' here is a bit of a misnomer because the samples used to sequence the 'human genome' were pooled at random from 20 donors, except that pool turned out to mostly be low quality, so 66% of the original human genome sequence was from one male donor, RPCI-11, who was later determined to be 50% White European and 50% African.
While the completion of the 'human genome' in 2003 was historic, and we learned a lot from it, we also learned that a single reference genome that's supposed to represent the 'average' human actually misses a ton of important variation.
Studies since the completion of that genome have shown that it is missing a lot of the variation observed across ancestral populations!
What this means in practice is that something that is identified as a 'variant' using our current reference genome might not actually be a variant depending on that individual's genetic ancestry.
This has HUGE implications for genomics, tracking disease, and identifying causal variants of those diseases in diverse populations!
So, to recap, we sequenced a couple people, created a linear consensus that serves as our reference, and called the genome done.
And we've continued to use that genome, despite knowing that, at best, it's a huge compromise and probably doesn't do a super good job of helping us identify all of the relevant variation in diverse populations.
Fortunately, humans aren't the only species that have this genetic diversity problem and microbes have served as a reasonable proxy for the development of a better solution.
Early work with mixed bacterial populations showed us that 'graph' genomes are much more powerful than linear ones.
Graph genomes are special because instead of settling on a single consensus, they annotate all of the variation observed at each position in the genome, meaning, you actually retain all of the important ancestral variation.
Fortunately, we can do the same exact thing in humans, and capture our species wide diversity in a pangenome!
This work has already begun and teams are contributing datasets to the Human Pangenome Reference Consortium, a group dedicated to bringing equity to the reference genome.
The first 3D structure of DNA was published in 1938. It was generated by Florence Bell, a scientist you need to know.
One thing that we lose in the coverage of major scientific discoveries is all of the work that those advances were built on.
A perfect example of this is Watson and Crick's solving of the structure of DNA in 1953.
This wasn't just a synthesis of data they obtained from Maurice Wilkins via Rosalind Franklin (and others), but it also wouldn't have been possible without the early work of William Astbury and Florence Bell.
This is that story.
In the 1930's, William Astbury spent his days analyzing biological fibers using a technique called x-ray diffraction.
He was particularly interested in coiled fibers like those found in wool (keratin) and other textiles and was the first to characterize the structural changes in proteins as they are stretched.
He referred to these as the α-form and β-form, and laid the groundwork for Linus Pauling's discovery of the α-helix and β-strand in 1951!
Astbury quickly got a reputation for his expertise in x-ray diffraction, and was sent purified biological material to characterize from all over Europe.
In 1937, apparently elbows deep in things to characterize, he sent a letter to another renown crystallographer, Lawrence Bragg, asking if he knew of any rockstar crystallographers that were available to help with his studies.
Bragg recommended Florence Bell, a Cambridge grad who learned how to do crystallography from yet another x-ray luminary, JD Bernall.
A short correspondence later and Bell left her job working for Bragg to start her graduate work under the tutelage of Astbury.
While her research was focused on lots of different biological fibers, Bell's most important work was with DNA.
She showed that the key to obtaining the most informative images was the use of high molecular weight DNA.
The best source for this was calf thymus, and the diffractions she obtained from these fibers indicated that DNA had an ordered structure.
This finding was published in 1938 and was also presented at Cold Spring Harbor later that year by Astbury.
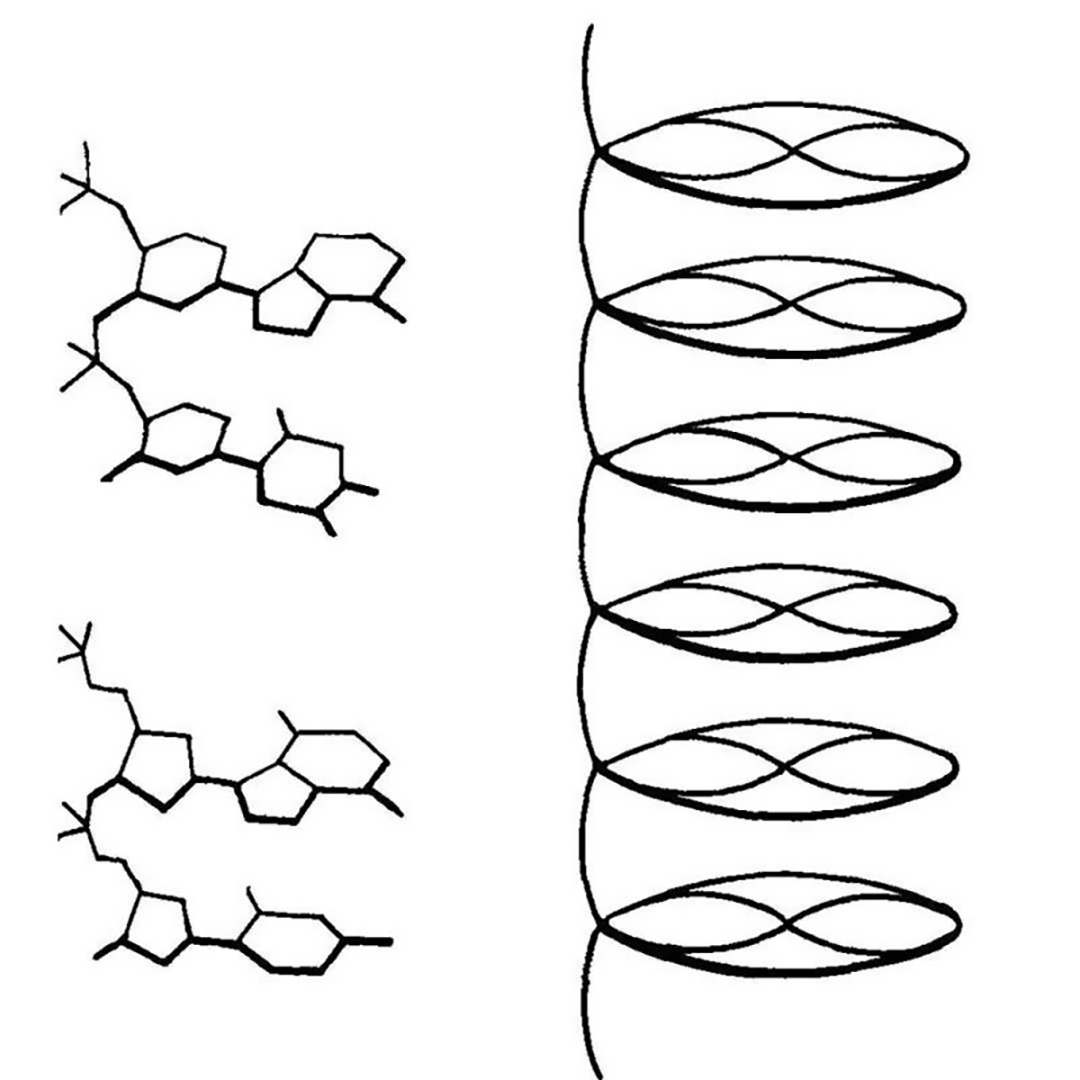
They described their structure of DNA as a 'pile of pennies' and a depiction of it can be seen in the figure above.
Their calculations also showed that the DNA nucleotides were 3.3 Å apart and they were stacked one on top of another.
While this might not seem like a historic achievement, it set the foundation for everything that would follow.
With a few tweaks and the discovery that DNA can exist in two forms depending on the humidity during drying, Rosalind Franklin and Raymond Gosling built on Bell's early work to generate photo 51 - the key diffraction of DNA used to solve the structure of DNA in 1953.
###
Astbury WT, Bell FO. 1938. Some recent developments in the x-ray study of proteins and related structures. CSHL Symp Quant Biol. DOI: 10.1101/SQB.1938.006.01.013
Were you forwarded this newsletter?
LOVE IT.
If you liked what you read, consider signing up for your own subscription here: