Omic.ly Weekly 42
September 15, 2024
Hey There!
Thanks for spending part of your Sunday with Omic.ly!
This Week's Headlines
1) The genetics of child sacrifice at Chichén Itzá
2) Checking your metrics is an important piece of the sequencing process
3) Phoebus Levene and the discovery of the 2-dimensional structure of DNA
Here's what you missed in this week's Premium Edition:
HOT TAKE: Australia just banned the life insurance industry from using genetic testing. America should too.
Or if you already have a premium subscription:
Ritual human sacrifice was an important part of ancient Mayan life and now genetics is helping us to identify the origins of those who were sacrificed.
Human sacrifice was a cornerstone of many ancient cultures and generally occurred as a part of their religious practices.
The purpose of these sacrifices was usually to pacify the gods or bring good fortune, be it in the form of success on the battlefield or a good harvest.
Many cultures stopped the practice of ritual human sacrifice before the birth of Christ, but the people living in Central and South America continued the practice up until (and during) the arrival of the Spanish Conquistadors.
For the Mayans (who occupied what is now southern Mexico, Guatemala and Belize), human sacrifice was seen as a way to feed the gods.
One of their best known sacrificial sites, Sacred Cenote, was located at Chichén Itzá, a large Mayan metropolis found on the Yucatán Peninsula.
Here, humans were sacrificed to the rain god Chaac and their remains were placed into a large cenote (a water filled sinkhole).
Over the years, some of these remains have been recovered and studied with archaeologists finding that many of those who were sacrificed were children.
But sacrifices to other gods also occurred at Chichén Itzá and in the late 1960’s, a cistern was uncovered near Sacred Cenote that contained the remains of approximately 100 children.
It was not immediately clear why these children were sacrificed, but now, new DNA evidence is able to give us some clues.
In this paper, the researchers were able to extract ancient DNA from the remains of 64 of the children that were sacrificed.
They found, surprisingly, that ALL of the children were male and many of them appeared to be related.
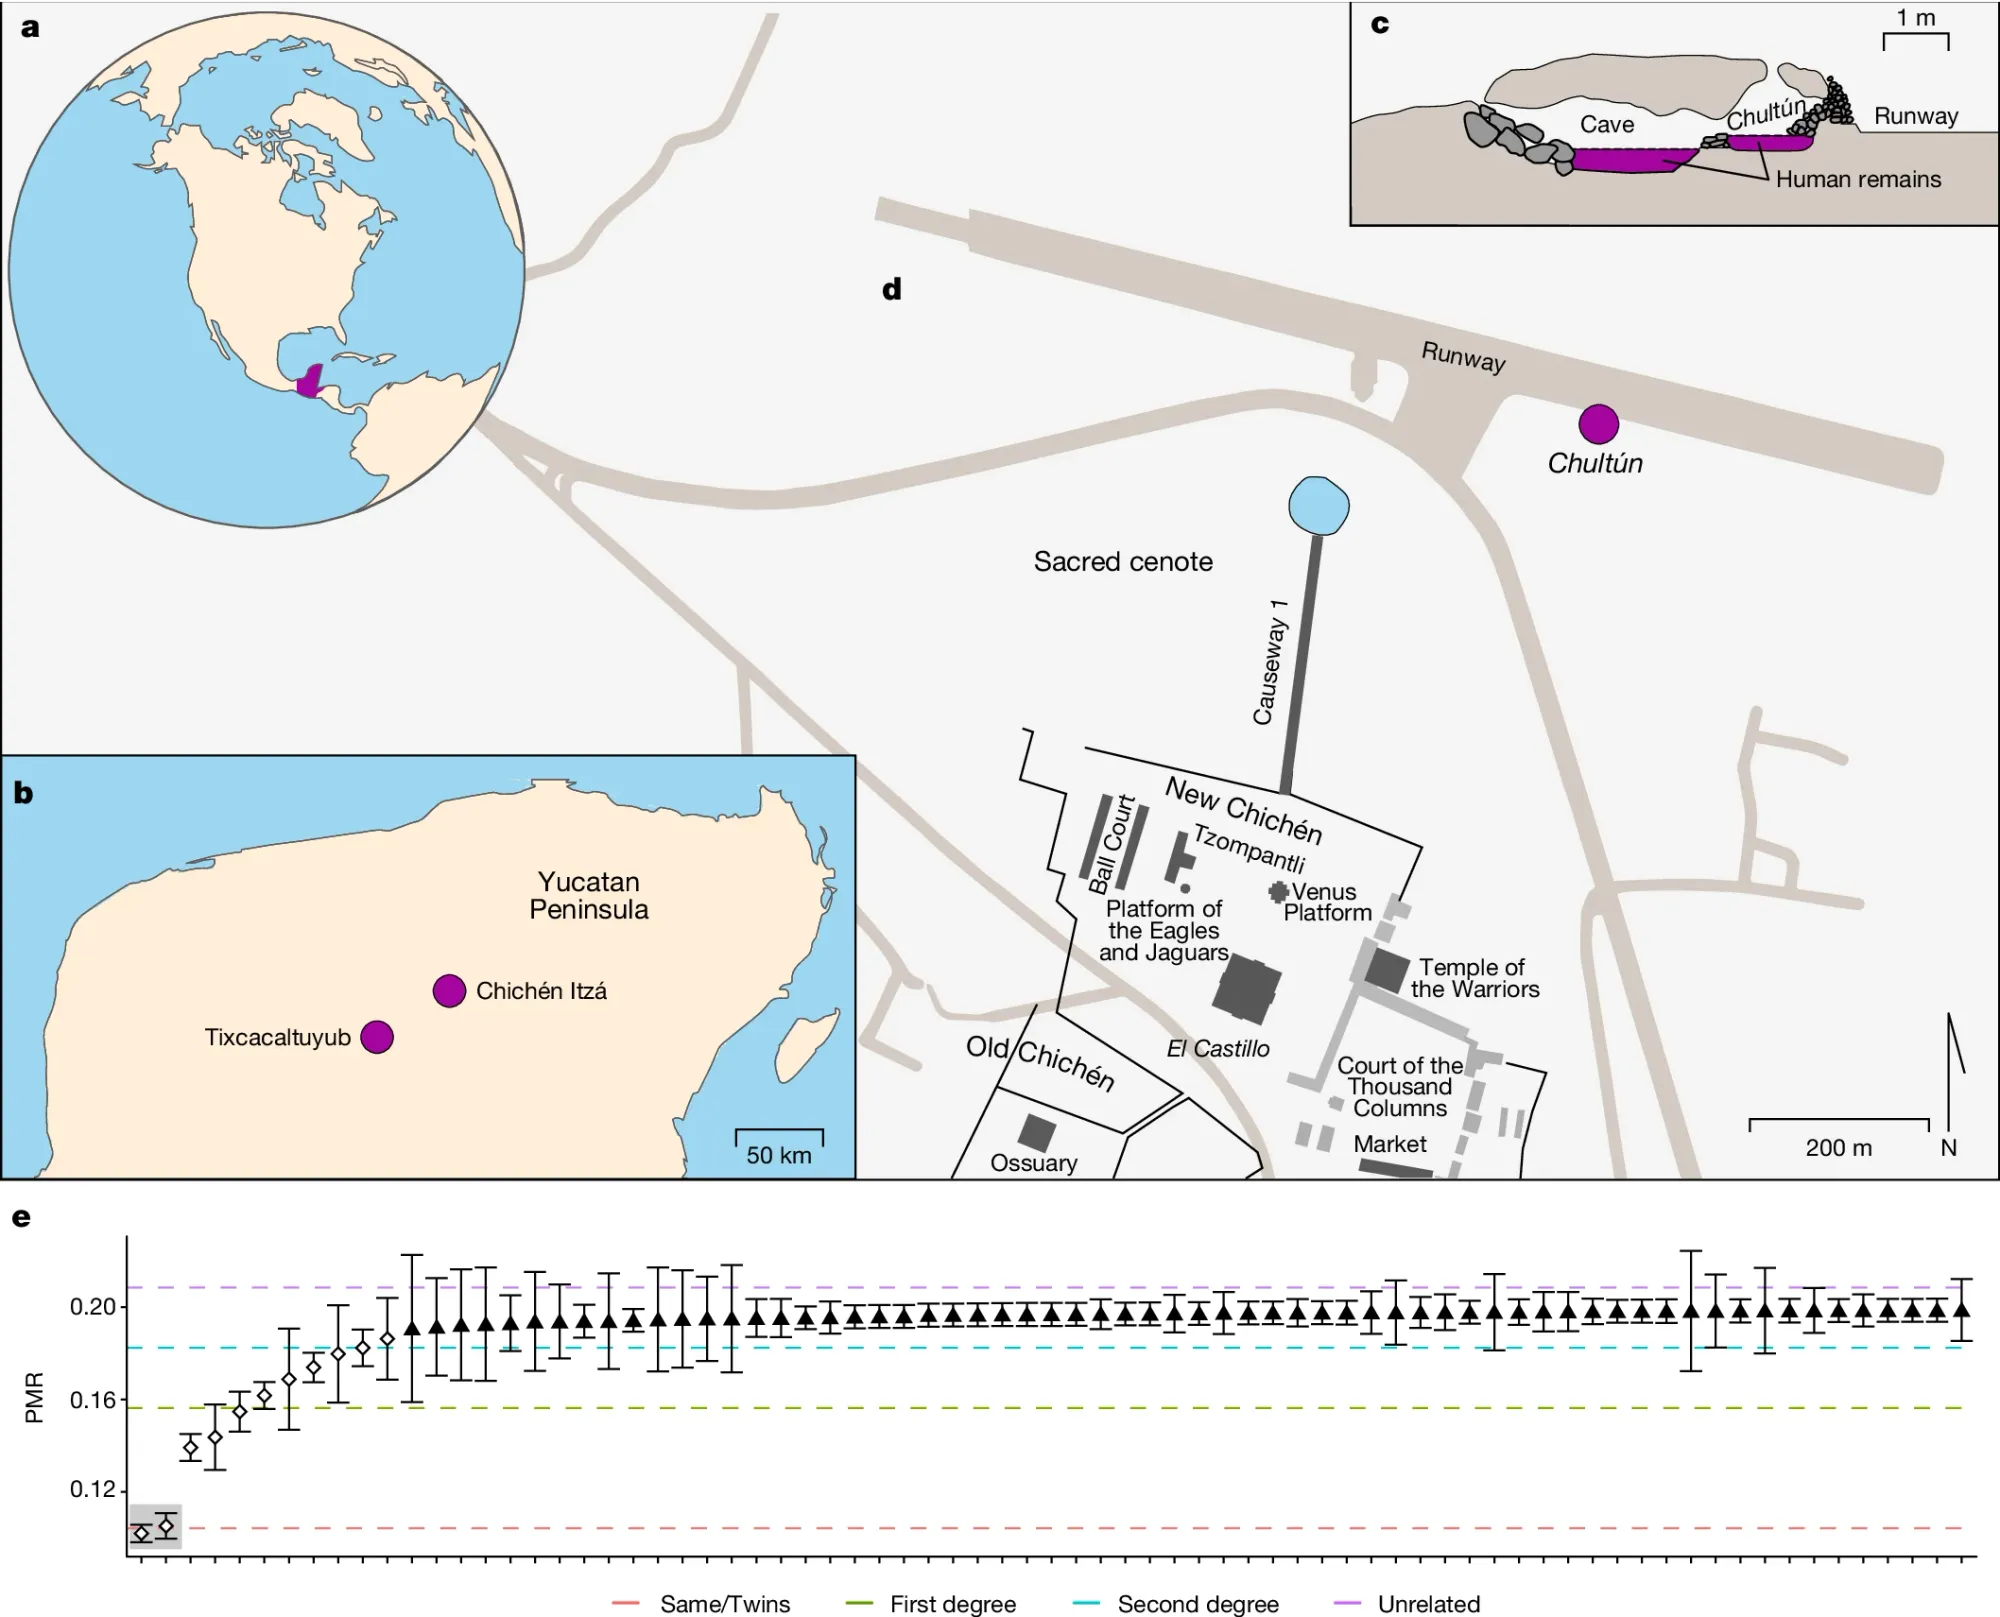
The figure above shows a) the Yucatán Peninsula (a region of current day Mexico) b) location of Chichén Itzá c) the chultún (cistern) where the remains of the children were found d) a map of the complex showing where the chultún was discovered in relation to Sacred Cenote e) the pair-wise mismatch rate (a measure of related-ness) of the 64 specimens including one set of twins (highlighted in gray)
The researchers went on to show that these children were all from local indigenous populations.
But, the discovery of twins and that these children were male and all appeared to be related led the researchers to hypothesize that these children were sacrificed to honor the “Hero Twins,” Hunapu and Xbalanque, who in ancient Mayan lore are reborn every year to avenge their father's death and torment the Gods of the underworld.
The Hero Twins are often depicted in Mayan art as stalks of maize (corn) and these ritual sacrifices could have also been an attempt to bring a good harvest.
Interestingly, because the sacrificial remains found in the chultún spanned approximately 500 years, the researchers were also able to see the effect of epidemics on the genomes of the Maya, noting an increase in the HLA-DR4 allele which confers resistance to "salmonella-derived peptides."
###
Barquera R, et al. 2024. Ancient genomes reveal insights into ritual life at Chichén Itzá. Nature. DOI: 10.1038/s41586-024-07509-7
High throughput sequencing metrics: Don't be a monster, review them before sending data to the triage team.

One of the most important things to avoid when doing high throughput sequencing is 'bias.'
Properly assessing your post-alignment and variant calling metrics is super important for ensuring that biased data is not used to generate a patient report.
Here are some of my favorite metrics to keep an eye on:
Percent High Quality (HQ) Reads Aligned - The percentage of HQ reads that actually align to the reference genome. Here HQ is defined as Q20 or better and this stat should be greater than 98%.
GC Bias Plot - This is one of my favorites and for short-read data it should look like an upside down U with high AT and high GC regions showing slight bias (because of amplification) and for long-read methods this plot is usually flat. Any major deviations can indicate bias either from over amplification or if this is target capture data, bias in the capture process.
Insert size - These plots show the size distribution of the sequenced inserts within your library. These should pretty closely mimic the distribution you see in fragment analysis.
Percent Duplication - This is a measure of the number of perfectly duplicated reads in a dataset. The ideal here is less than 5% and usually if you see problems with read duplication you'll also see issues in the GCbias plot.
Coverage - A measure of the average depth of coverage across the genome or your provided target capture probe set.
Transition/Transversion Ratio (TiTv) - Transitions are A<>G or C<>T (substitutions within the purines and pyrimidines) and Transversions A<>C, A<>T, C<>G, and G<>T (conversion of a purine to a pyrimidine, etc). For genomes the expected TiTv is 2 and for exon capture panels it's 3. Major deviations from these values could indicate a bias during sequencing or sample degradation during storage.
Strand Bias - A measure of the bias of the genotype calls made on the positive and negative strands. No bias means calls are the same on each of the complementary strands, high bias means the calls differ and high strand bias around variant calls could indicate an over-reporting of false positives.
Target capture specific metrics:
Fold80 Penalty - This is a measure of evenness or uniformity. The best captures are ones that have perfect uniformity. Fold80 penalty is defined as "fold over-coverage necessary to raise 80% of bases in targets to the mean coverage level." 1 is perfect, so any deviation from that indicates a bias in capture. The best captures are <1.5.
Percent Reads On Target - This is a measure of how much sequencing is being wasted on non-specific binding or off target. This value can vary greatly depending on the size of your capture from 60-70% for an exome down to <20% for smaller capture panels. Deviations from the expected value can indicate bias.
Watson and Crick were the first to describe the structure of the DNA double helix. Their major contribution to science was, at its core, a synthesis of all of the best data available at the time.
This statement isn’t meant to discount what they did in 1953, but more so to recognize all of the foundational work that preceded them.
1869 - Nuclein (DNA) is discovered - F. Miescher
1912 - The hydrogen bond is proposed - T. S. Moore and T. F. Winmill, Popularized by L. Pauling
1935 - DNA is a macromolecule with a sugar phosphate backbone - P. Levene
1943, 1952 - DNA is the genetic material - Avery-MacLeod-McCarthy, Hershey-Chase
1950 - A and T, G and C are in a 1:1 ratio - E. Chargaff
1952 - DNA is a double helix - Rosalind Franklin, she got the math right
1953 - Watson-Crick base pairing - Broomhead, Donahue, Watson, Crick
While all of these pieces were required for the final structure to be determined, the bulk of the basic chemistry was done between 1905 and 1935.
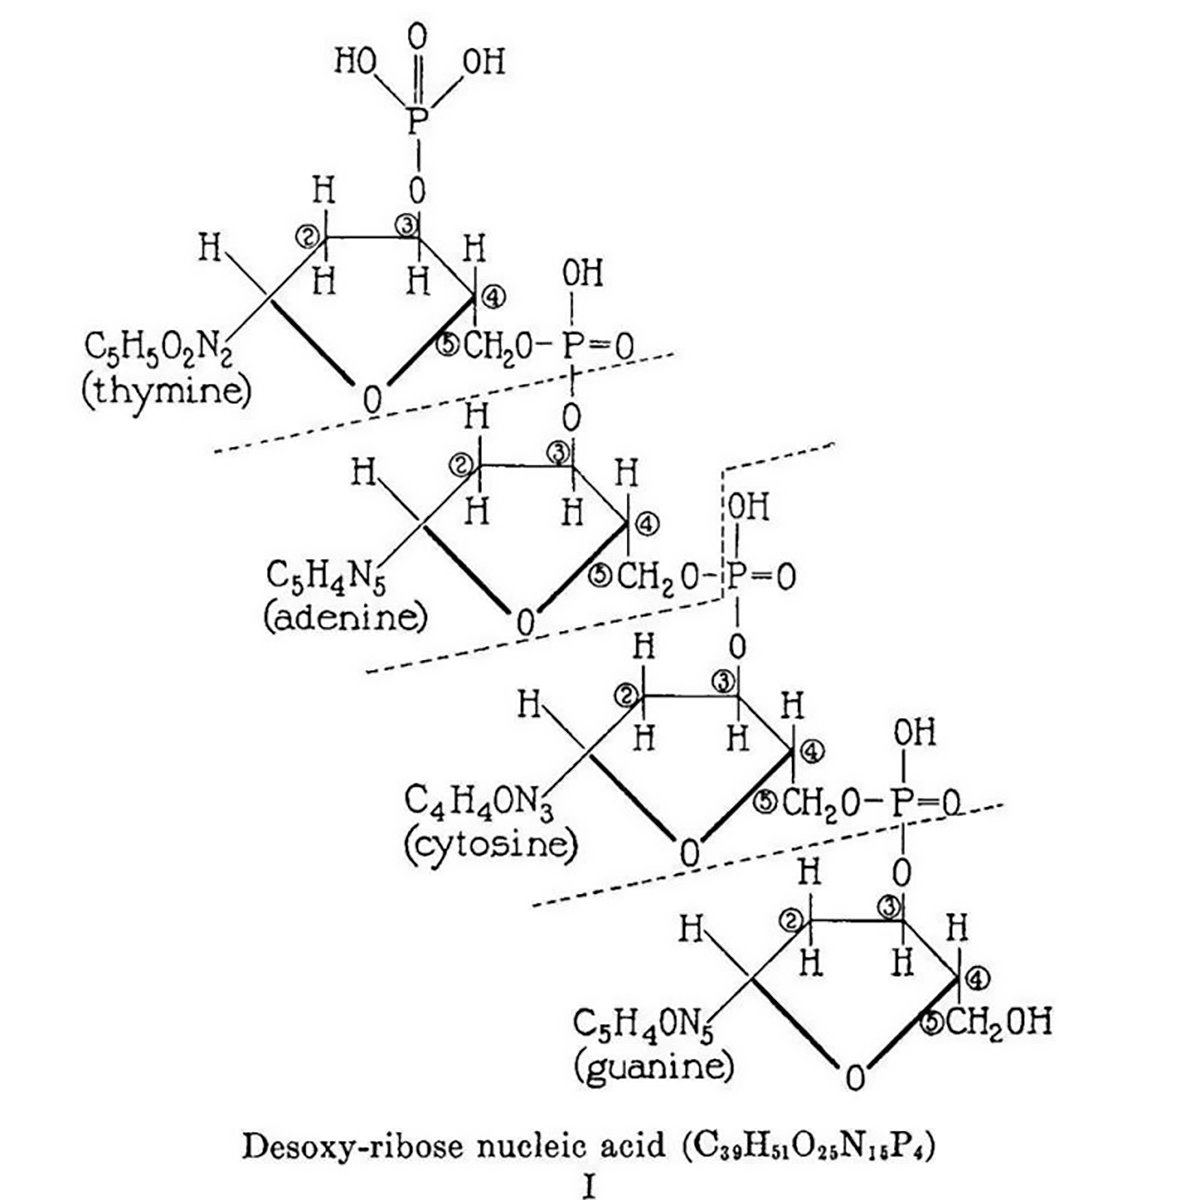
The figure above is the culmination of the life’s work of Phoebus Levene.
He's probably not someone you’ve heard of before.
He was the first to discover that nucleic acids are composed of ribose sugars.
He also determined that these sugars were connected by a phosphate backbone.
And, he eventually figured out that DNA is made of 2-deoxy-D-ribose while RNA is D-ribose.
Oh, he also confirmed the identities of all of the bases: Adenine, Thymine, Guanine, Cytosine and Uracil.
And he's the reason why we call these bases nucleotides!
Pretty mind blowing, right?
This work is summarized in the figure which displays Levene's 2 dimensional chemical structure for 'Desoxy-ribose nucleic acid.' This structure isn't perfect (Cytosine is labeled as a diphosphate and the chemical composition of the nucleobases is a little off) but it does accurately depict the 5'-3' sugar phosphate backbone of DNA.
Now, the reason why you've never heard of Levene is because he proposed the 'tetranucleotide hypothesis' which stated that DNA was merely a structural molecule composed of 4 repeating nucleotides.
He was certain this meant DNA was too simple to be the carrier of genetic information.
Like everyone else, he believed that proteins were the obvious choice as the genetic material since there are 5 times as many amino acids.
Unfortunately, Levene's hypothesis took the spotlight off of DNA for decades and this has been described as a 'scientific catastrophe' despite Levene getting the basic chemistry and the 2D structure of DNA mostly correct.
So, for Watson and Crick to finally put the 3D puzzle together it took a renewed interest in DNA as the genetic material, Levene's chemistry, the ratio of the bases from Chargaff, (borrowed?) X-ray diffraction data from Franklin, and a couple pints at the Eagle pub in Cambridge.
The rest is (a very disputed) history.
###
Levene PA, Tipson RS. 1935. The ring structure of thymidine. JBC. DOI:10.1016/S0021-9258(18)75193-4
Were you forwarded this newsletter?
LOVE IT.
If you liked what you read, consider signing up for your own subscription here: